OSMOSIS main achievements
The project has been successfully completed demonstrating the feasibility and prototyping an integrated system going from the synergetic use of many different variables measured from space to the modelling of the distribution of micronektonic organisms.
|
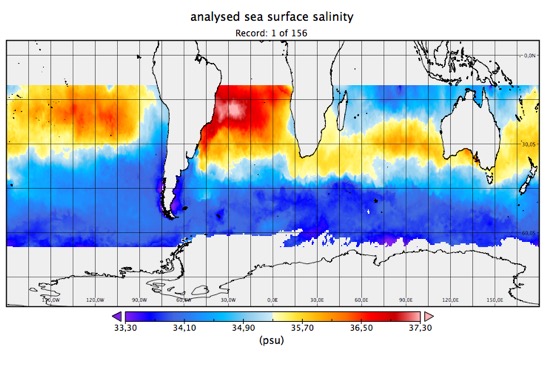
A
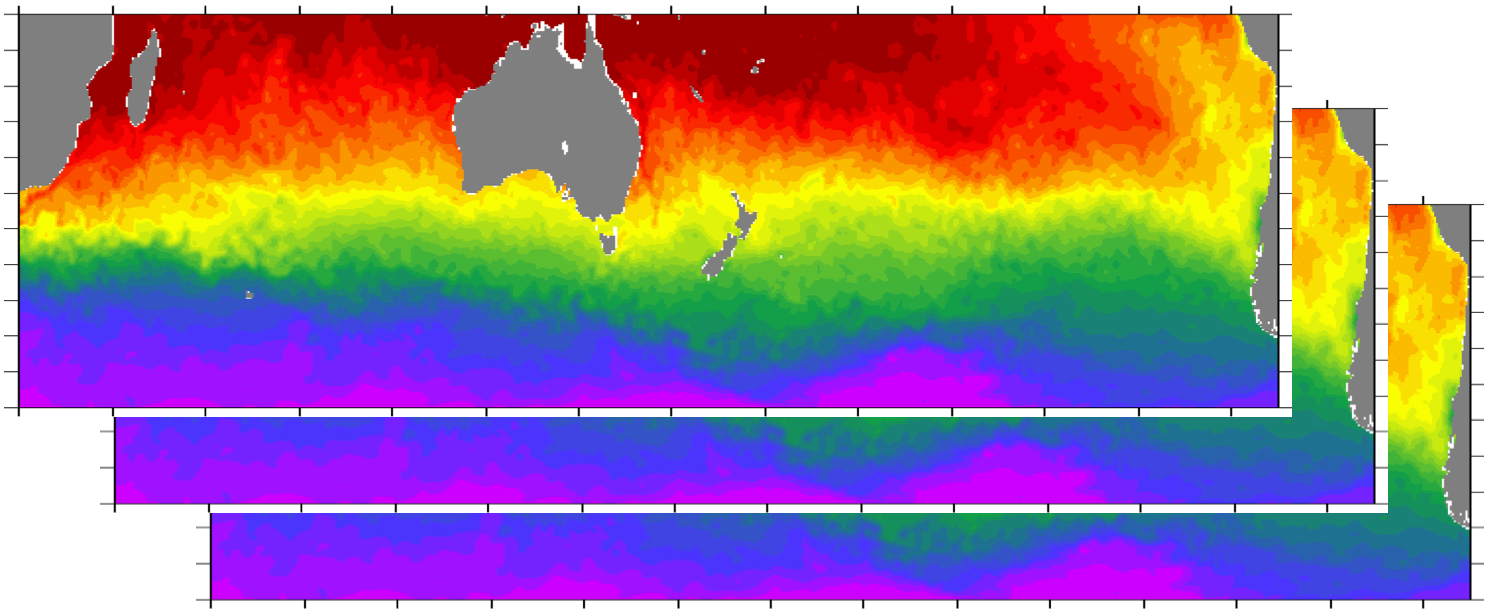
new merged in-situ-satellite SSS
L4 product has been developed and validated by CNR. The new product is
obtained by applying a multidimensional covariance model for the
combination and optimal interpolation of in situ and SMOS salinity data
using high resolution information extracted from satellite SST.
|
 |
 |
CALCULATING 3D FIELDS OF TEMPERATURE AND SALINITY FROM SPACE AND IN-SITU DATA Compared to previous method used at CLS for 3D Ocean
State reconstruction, a number of improvements have been
implemented in the framework of OSMOSIS: the WOA13
climatology is now used as first guess instead of the
ARIVO11 field; new, optimized parameters have been defined and used in
the
optimal interpolation method; the new OSMOSIS SSS L4 product
presented was used together with satellite altimeter SLA
to reconstruct synthetic salinity fields at depth. |
|
SURFACE CURRENTS RETRIEVAL FROM GOCE AND ALTIMETER DATA Different
recent geoid models based on GOCE data have been tested for calculating
mean geostrophic velocities. |
 |
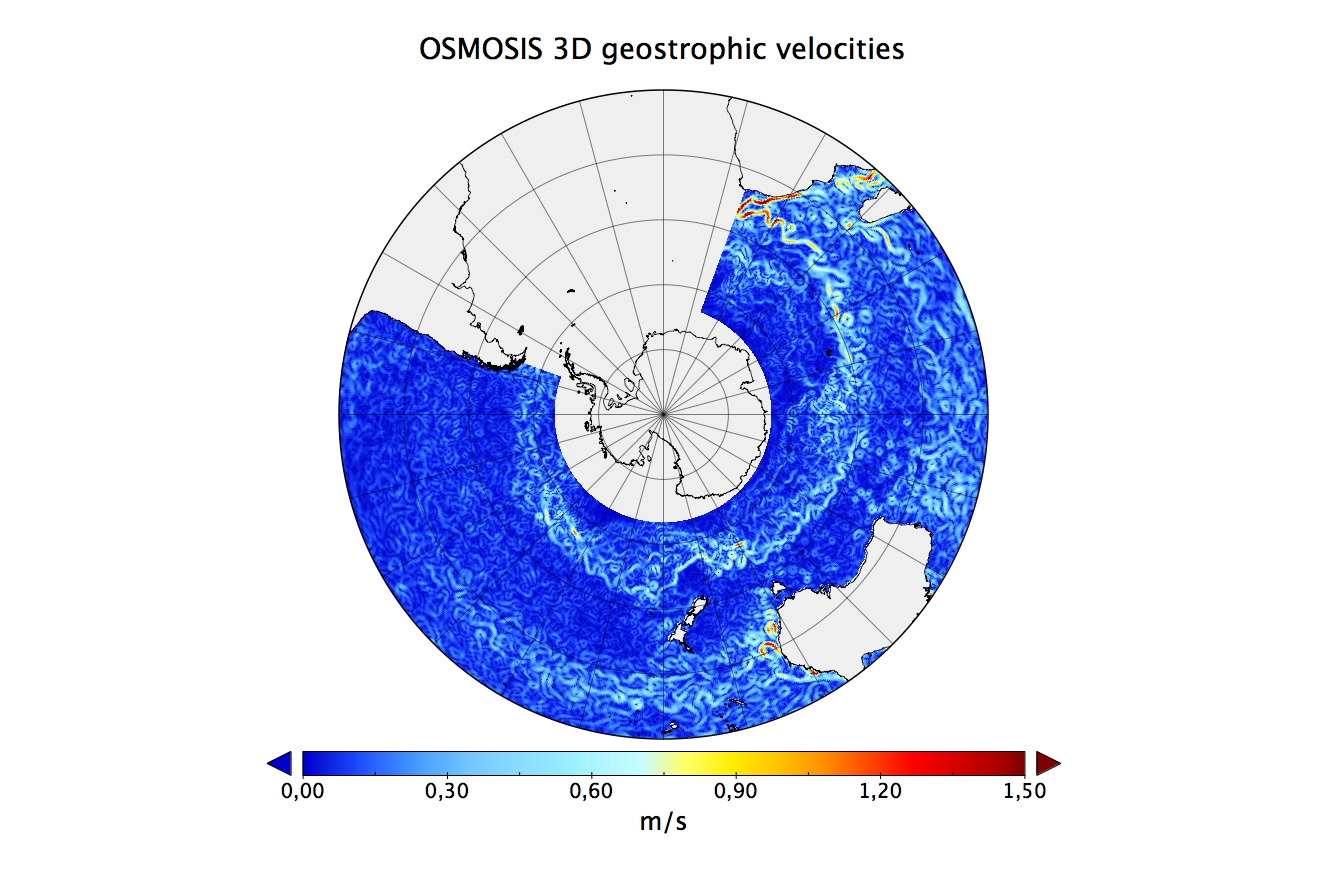 |
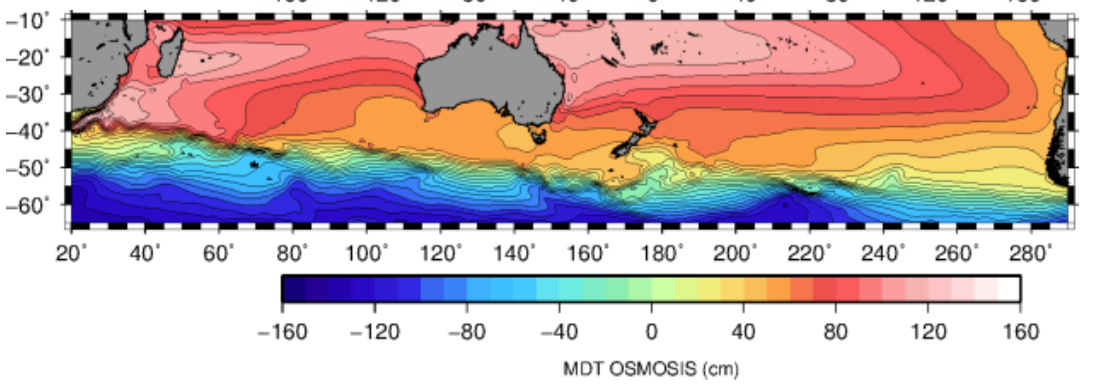
CALCULATION OF 3D GEOSTROPHIC VELOCITIES The
geostrophic ocean currents have been
estimated referencing the dynamic heights to the surface and estimating
the surface geostrophic velocities from the absolute dynamic topography
maps computed as the sum of the altimeter SLA and the OSMOSIS MDT. |
|
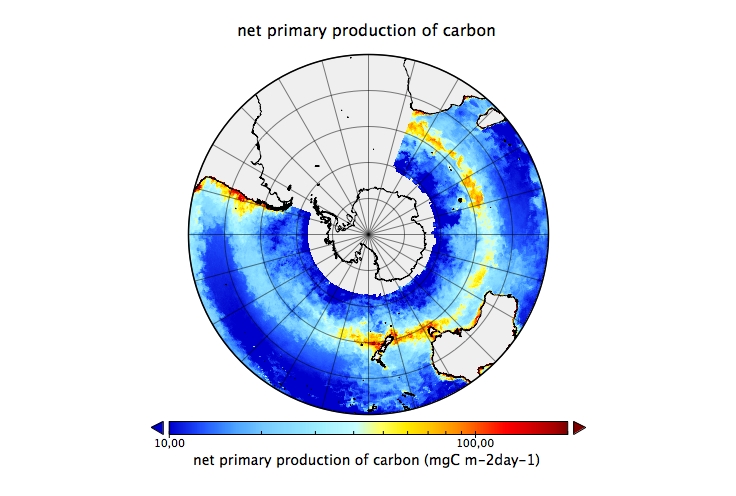
NET PRIMARY PRODUCTION RETRIEVAL NPP maps were produced at CLS in near real time using the VGPM model. These maps differ from the Oregon State University maps due to the different input data feeding the VGPM model. In particular, the CLS NPP product exhibits enhanced coverage below 55 South, due to the enhanced coverage of the merged MODIS and MERIS Polymer chlorophyll maps.The CLS NPP maps can be downloaded here.
|
 |
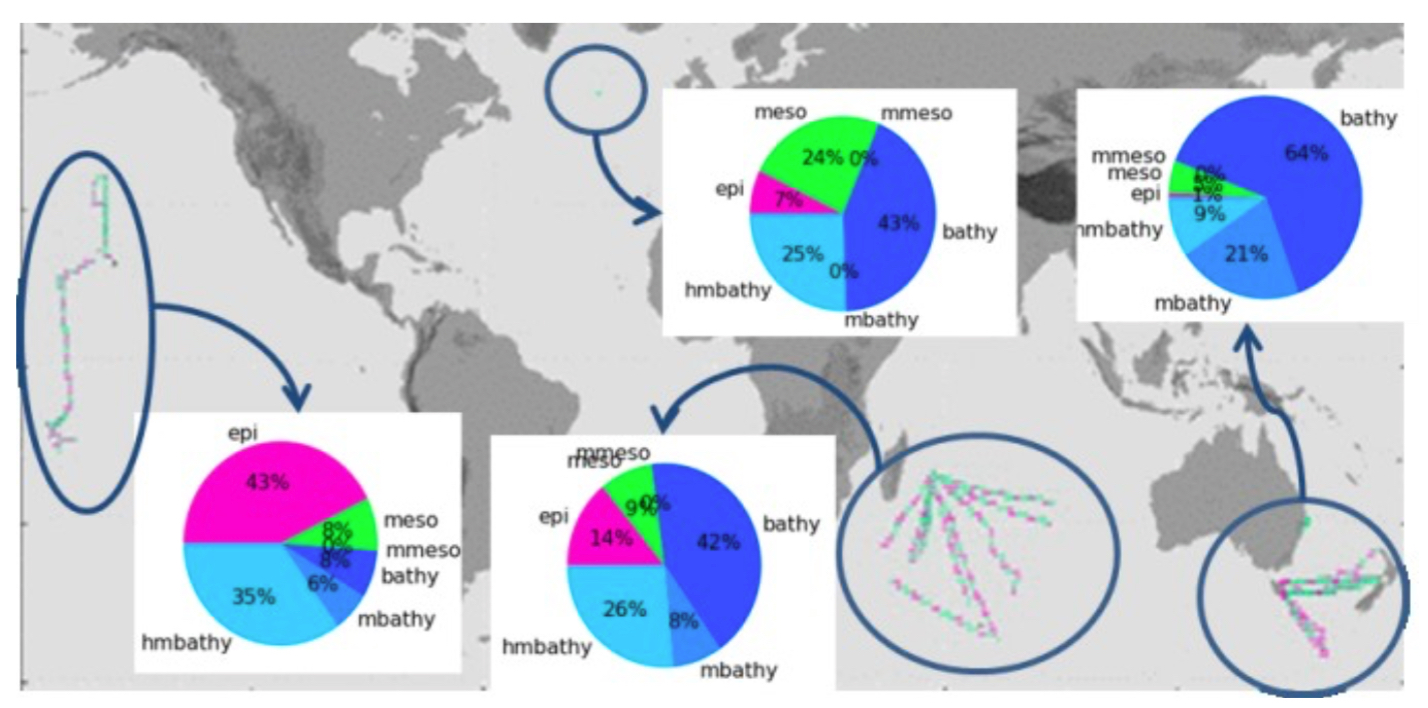 |
MICRONEKTON MODEL OPTIMIZATION RESULTS The
experimental datasets (net primary production,
euphotic layer depth, temperature, ocean currents) produced during
OSMOSIS have been used as inputs to the micronekton model
(SEAPODYM-MTL) to
estimate a
time series of the different functional micronekton groups biomasses
distribution. Micronekton model outputs are evaluated using 38 kHz
acoustic (NASC) data (14 and 10 transects in Indian and Pacific Oceans
respectively) that provide observed abundance indices of micronekton
between surface and ~1000 m depth. |
Publications:
- Buongiorno Nardelli B., Droghei R., Santoleri R. 2016: Multi-dimensional interpolation of SMOS sea surface salinity with surface temperature and in situ salinity data, Rem. Sens. Environ., in press, doi: 10.1016/j.rse.2015.12.052
- Droghei R., Buongiorno Nardelli B., Santoleri R. 2016: Combining in situ and satellite observations to retrieve salinity and density at the ocean surface, J. Atmos, Oceanic Technol., under review.
- Conchon, A., O. Titaud, B. Calmettes, N. Behagle, P. Lehodey, 2016 : Predicting average micronektonic layers depth in the mesopelagic global ocean. ICES Journal of Marine Science (submitted)
- Rio, M.-H., B. Buongiorno-Nardelli, B. Calmettes, A. Conchon, R. Droghei, S. Guinehut, G. Larnicol, P. Lehodey, P.P. Matthieu, S. Mulet, R. Santoleri, I. Senina, J. Stum, N. Verbrugge, 2015: Ocean ecosystem modelling based on observations from satellite and in-situ data: First results from the OSMOSIS project. Proceeding of the Sentinel-3 for Science Workshop, Venice, Italy, June 2-5 2015.